Reports and Dashboards
PraxisTime’s BI tool helps end-users stay competitive by providing real-time analytics.
PraxisTime provides full visibility into productivity and labour events – helping managers and executives of manufacturing operations make real-time decisions that boost productivity, improve resource utilisation, and maximise profits.
| FLEXIBLE | DISCOVERABLE | OPERATIONAL |
|---|---|---|
| PraxisTime has been built from the ground up with self-service customization in mind. From a critical presentation in the boardroom to casual analysis, you’ll have the flexibility to manipulate existing reports in new ways. This is the most important part of next generation analytics. | Modern users want instant insights into massive data sets. PraxisTime's easy-to-use Reports with drag and drop criteria you can discover data you didn’t even know you had or start building reports even if you don’t fully understand the data model. | For users who thrive on Microsoft Excel, PraxisTime provides full support for detail-oriented operational reports needed to keep day-to-day business operations moving. You have the power to slice and dice data with dynamic pivots and analysis grids. |
|
|
|
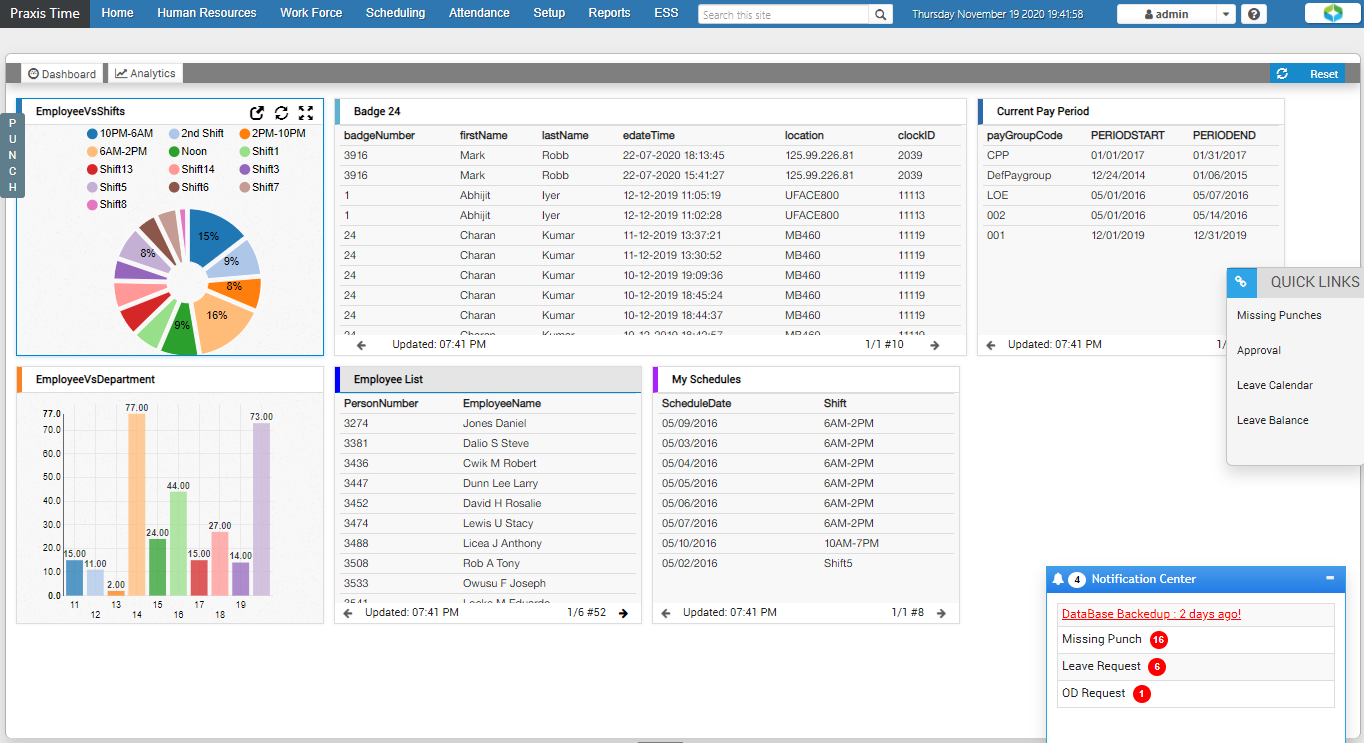
Give Users Customizable Dashboards
Dashboards are a dynamic and interactive way to view critical information from multiple sources in a single view. Users can hover over a report to get details, or drill down into it for greater insight. Users can create and customize their own dashboards, then use them to print, save, share and send reports. Security options let you decide who can view or make edits.
| INTERACTIVE | ANALYTICAL | CUSTOMIZABLE |
|---|---|---|
|
|
|